Logs
Logs
The Logs page on the dashboard consists of two tabs:
- Query Log—the query log contains details about the queries that are made to your Connect AICData Connect SpreadsheetsEmbedded Cloud account.
- Audit Log—the audit log records administrative tasks, including user creation, permission changes, and more.
Query Log
The Query Log tab displays a list of performed queries and the following information for each one:
- Timestamp—the time when the query occurs, formatted as YYYY-MM-DD HH:MM:SS AM/PM UTC.
- Query Type—the category of the query.
- User—the login Id of the Connect AICData Connect SpreadsheetsEmbedded Cloud user who makes the query.
- Status—the final state of the query; that is, whether it succeeded or failed.
-
Query Text—the text and destination of the query.
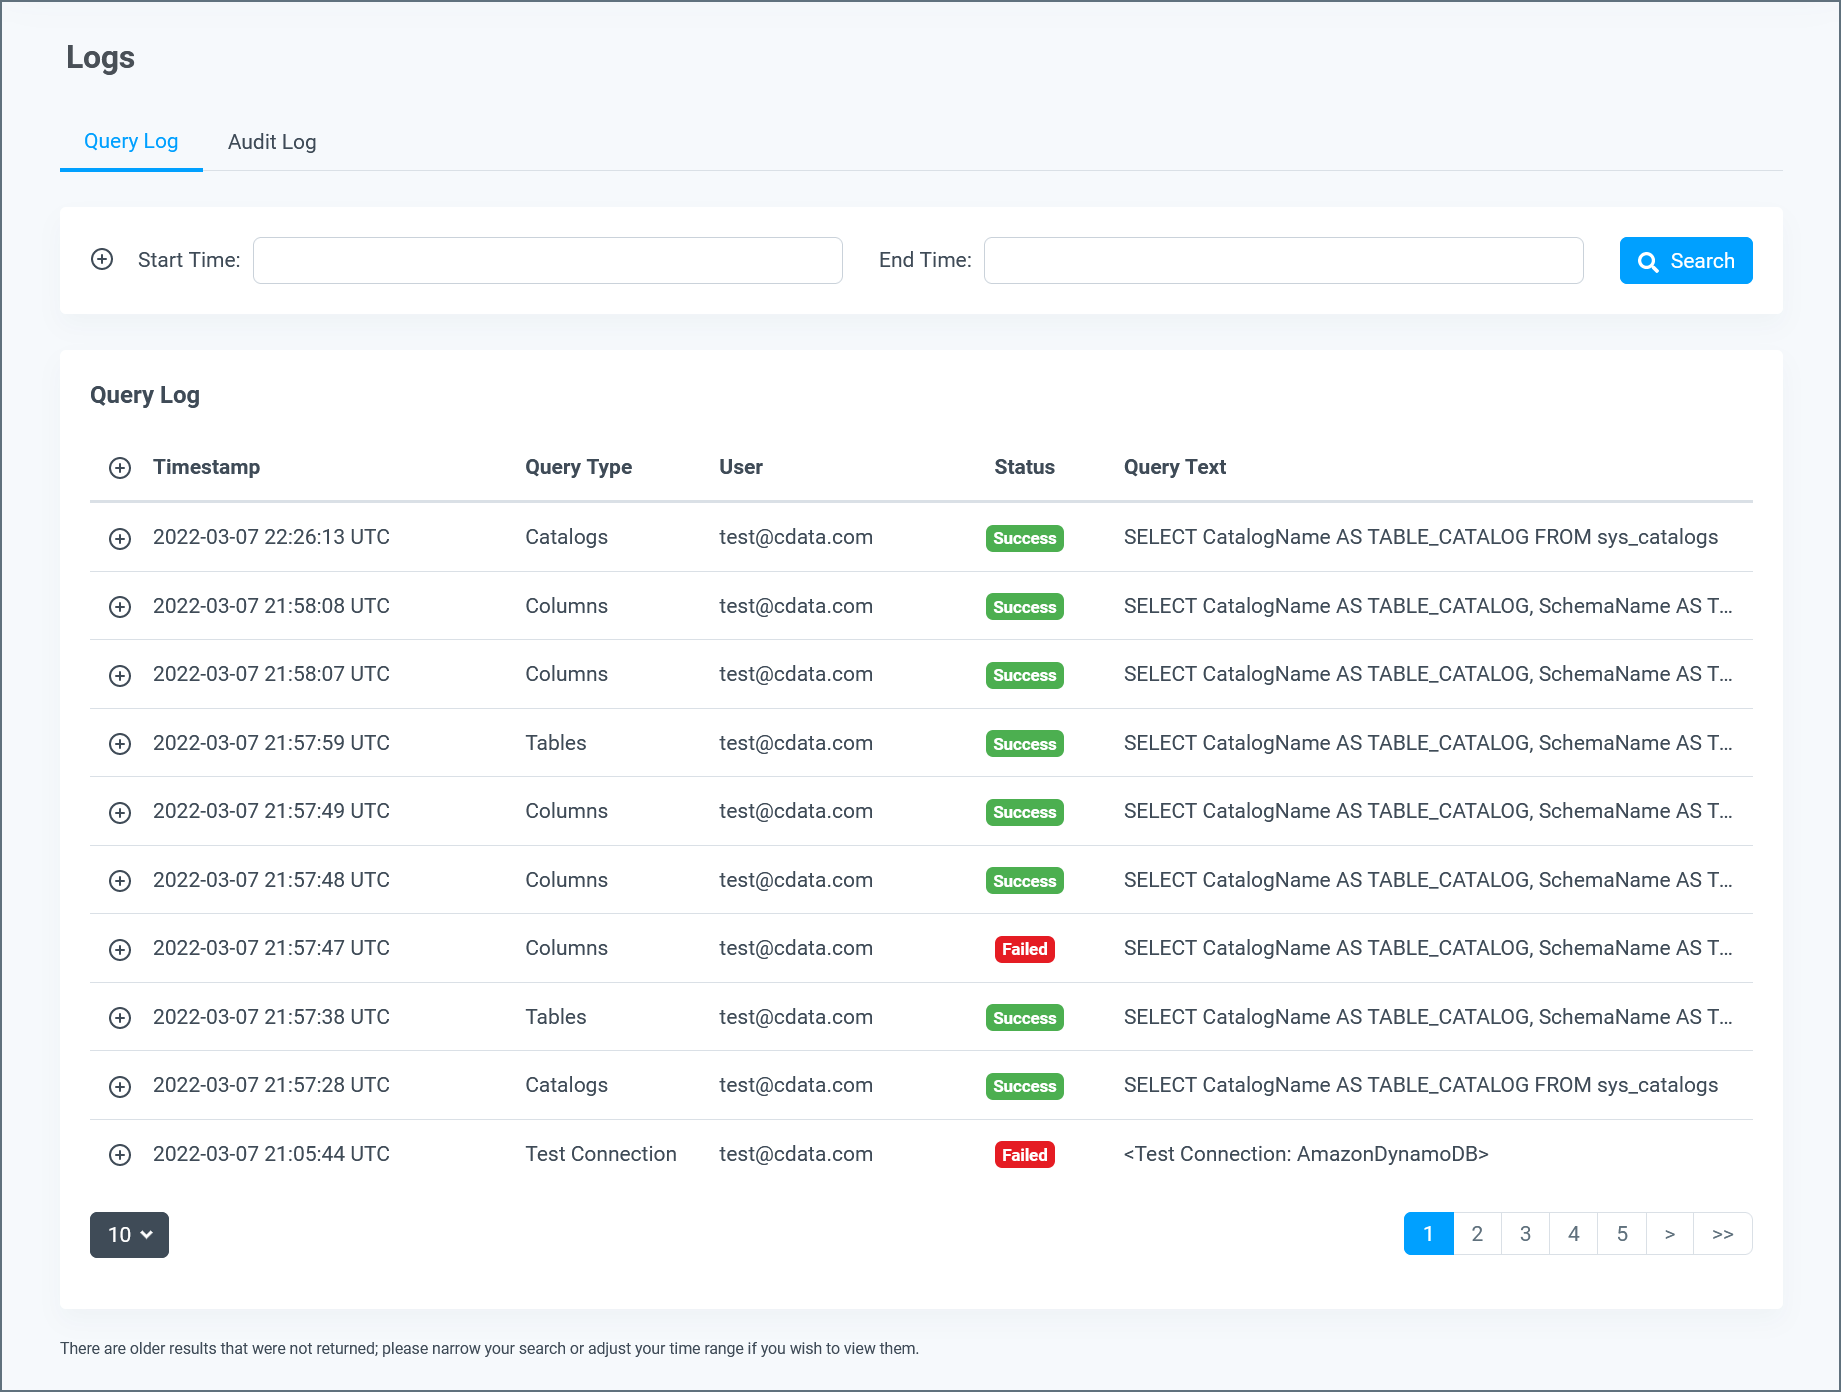
At the bottom of the query table, you can select the number of queries to display per page and you can navigate among pages of results.
Query Details
Clicking any query in the log expands the query and displays detailed information about it. The fields and contents can vary among queries of different types.
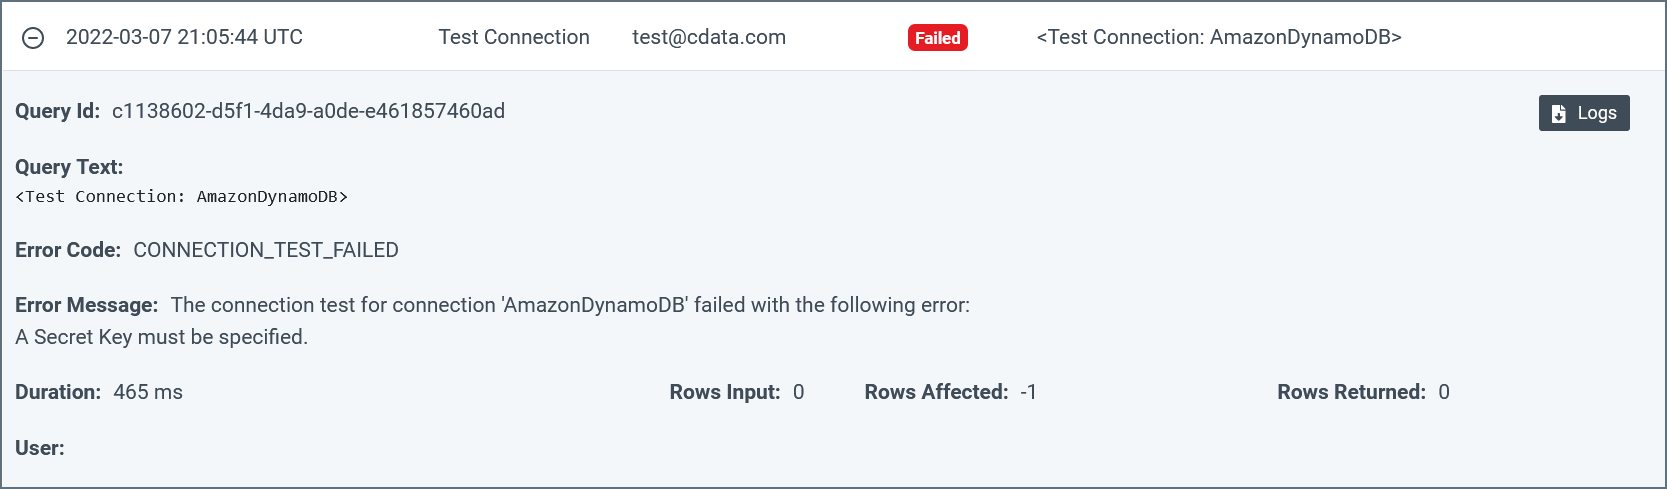
You can click the Logs button in a query details section to download a log file that contains details about the query. These log files are useful in troubleshooting errors that are related to issuing queries to Connect AICData Connect SpreadsheetsEmbedded Cloud.
Notes:
- You can increase or decrease the logging verbosity for a connection on the Advanced Settings page for that connection. The default verbosity is 2. See Data Sources for more information.
- Connect AICData Connect SpreadsheetsEmbedded Cloud saves log files for seven days only. Log files older than seven days are deleted automatically.
Filtering
The section above the query table allows you to filter queries by Query Id, date range, query type, user, and/or status.
- Date Range—displays only queries that match the given date range (such as the last 7 days) or a custom date range selected from the date picker.
- Query Type(s)—displays only queries of the type(s) that you select.
- User—displays only queries that are performed by the specified user. name.
- Status—displays only queries that were a success or that failed.
-
Query Text or Query Id—displays only queries that include the entered text or match the Query Id.
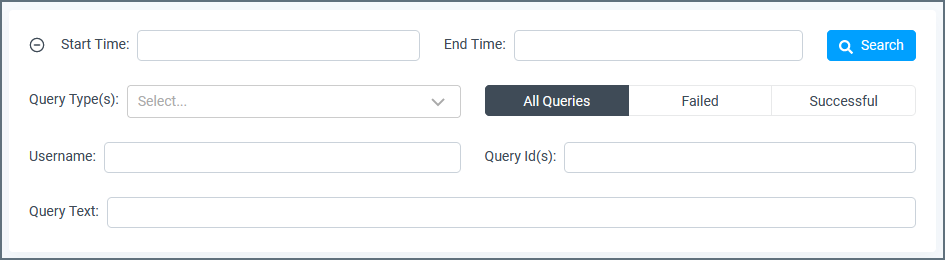
Click Apply to apply the selected filter(s) to the query table and perform a search. Click Clear all to start over.
Audit Log
The Audit Log tab displays a list of audit events and the following information for each event:
- Timestamp—the time when the event occurs, formatted as YYYY-MM-DD HH:MM:SS AM/PM UTC.
- Event Type—the category of audit event.
- User—the login Id of the Connect AICData Connect SpreadsheetsEmbedded Cloud user who performs the administrative task.
-
Target Resource—the category and the name of the targeted resource.
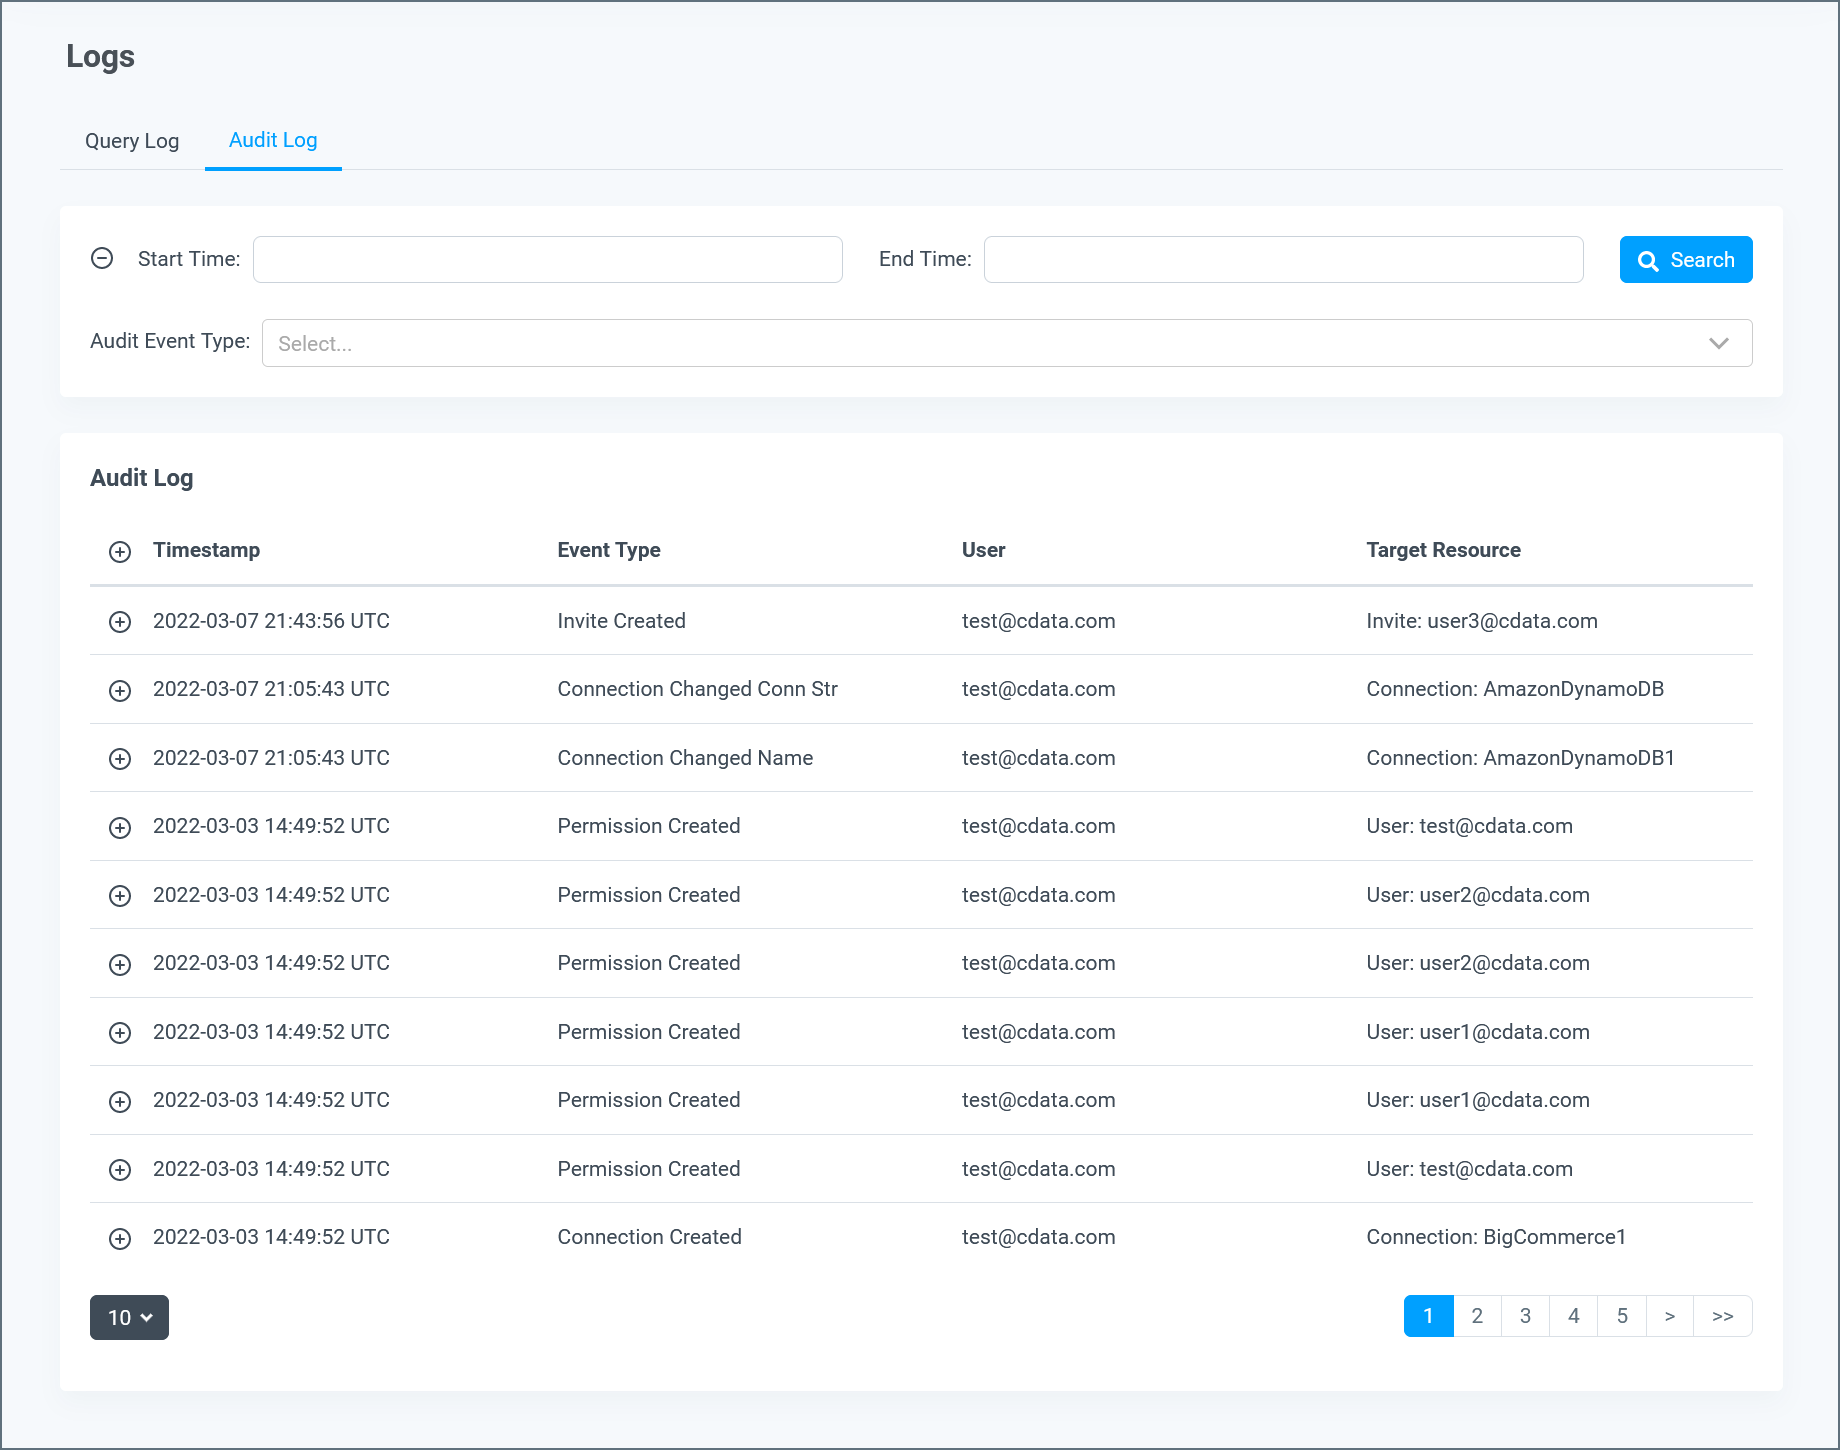
At the bottom of the audit table, you can select the number of entries to display per page and navigate among pages of results.
Audit Details
Clicking any entry in the audit log expands the entry and displays detailed information about it. The fields and content can vary among entries of different types. Some entries do not have any detailed information to display.

Filtering
The section above the audit log enables you to filter entries by date range, event type(s) and user.
- Date Range—displays only entries that match the given date range (such as last 7 days) or a custom date range selected from the date picker.
- Event Type—displays only entries of the type(s) that you select.
-
User—displays only entries that are performed by the specified user name.
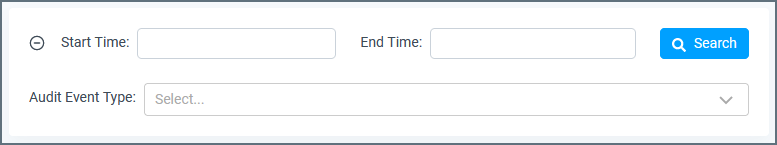
Click Apply to apply the selected filter(s) to the audit log table and perform a search. Click Clear all to start over.