Dashboard
Dashboard
The Dashboard page opens when you log in to Connect AICData Connect Spreadsheets. It provides a high-level overview of recent queries and account activity.
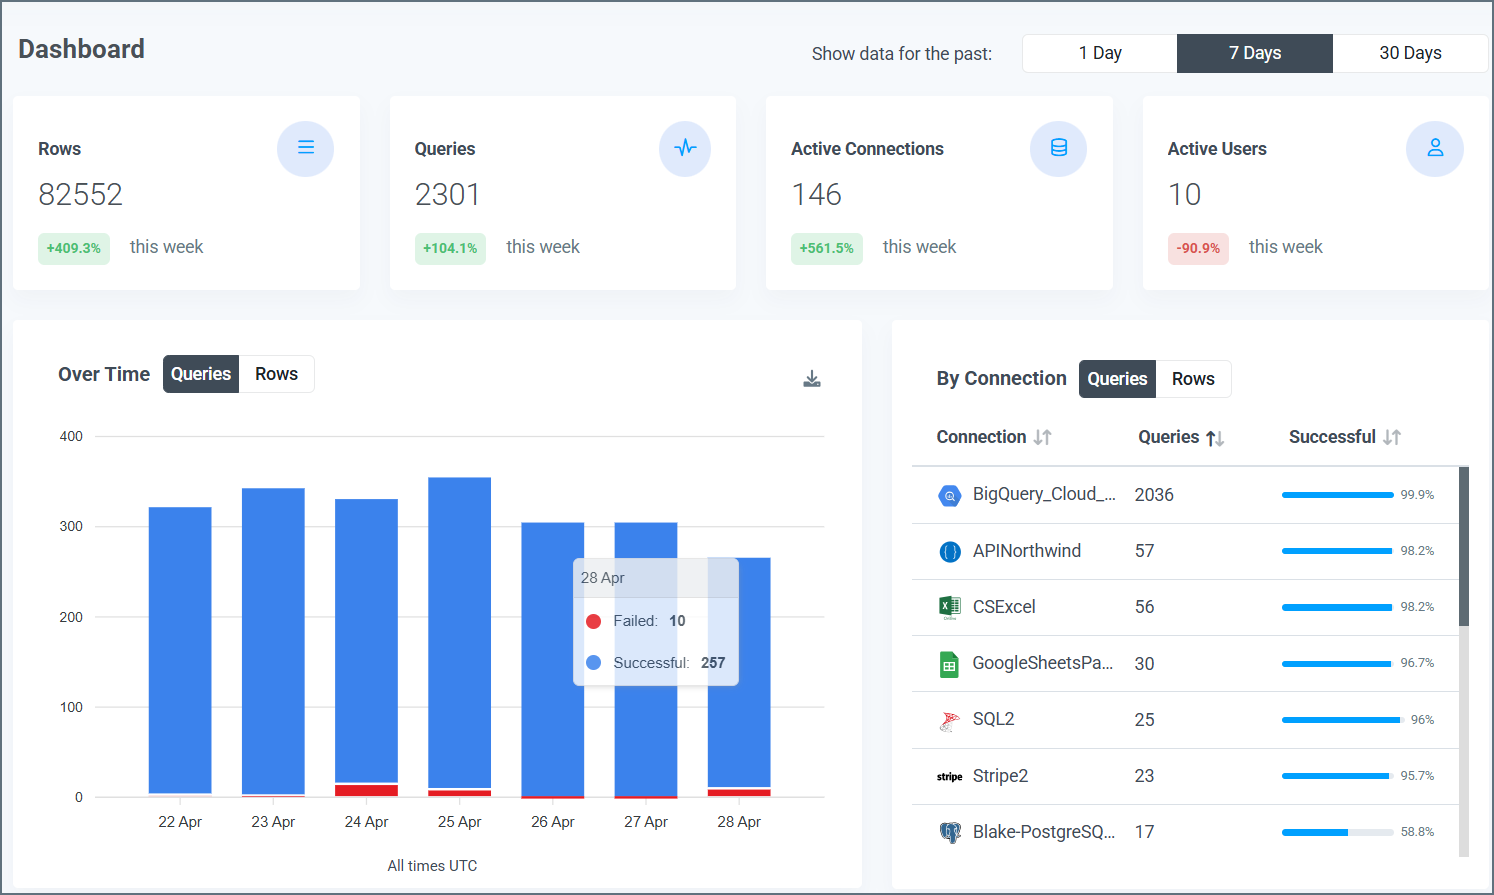
The upper-right corner of the page displays buttons to adjust data for the past 1 Day, 7 Days, and 30 Days. Clicking one of these buttons refreshes the page and adjusts the displayed data accordingly.
Information Boxes
Information boxes at the top of the page display the quantity for each of these four categories in the selected time period:
- Queries: The queries that are performed
- Rows: The rows that are processed
- Active Connections: The active connections on your account
-
Active Users: The active users in your account
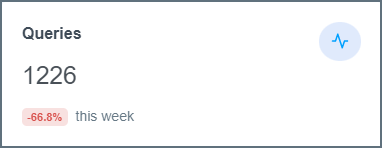
Underneath the count, each box displays the percentage change compared to the previous time period. This percentage change adjusts dynamically based on the time period that is selected.
Data Visuals
Under the information boxes, the Dashboard page displays three visuals:
- Queries Over Time
- Queries by Connection
- Queries by User
Queries Over Time
This bar graph shows the total number of queries that are made through your Connect AICData Connect Spreadsheets account over the selected time period. The x-axis displays the dates, and the y-axis displays the number of queries.
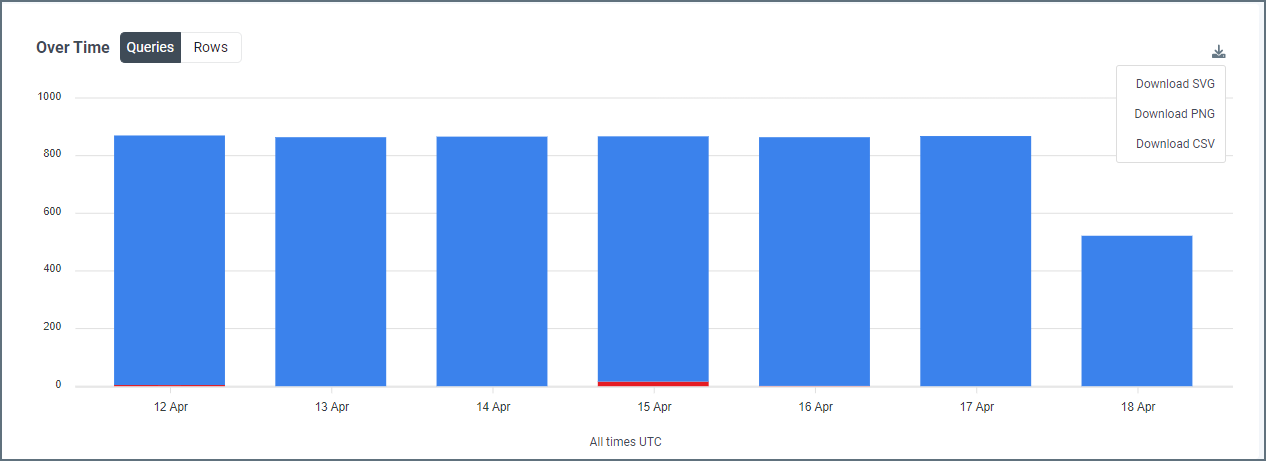
Each bar is composed of two sections:
- The number of successful queries, displayed top portion of the bar and colored blue
- The number of failed queries, displayed as the bottom portion of the bar and colored red
Clicking the down arrow icon in the upper-right corner of the section opens an export menu. This menu enables you to export the graph as a data file.
Queries by Connection
This table displays the number of queries that are made by each connection in the selected time period.
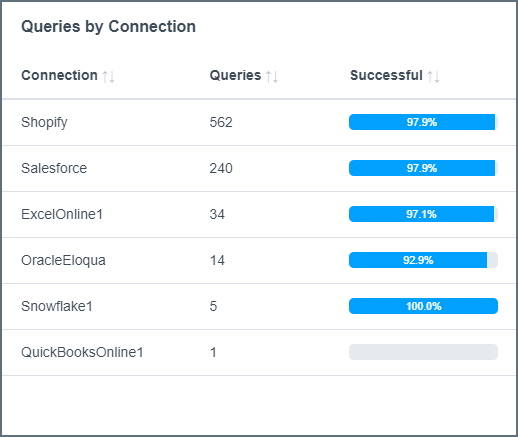
There are three columns in this table:
- Connection: The name that is given to the connection on the Connections tab
- Queries: The total number of queries, both successful and failed, that are made by the connection in the selected time period
- Successful: The percentage of queries from the connector that succeed in the selected time period
Clicking the name of a column sorts the table by that column. If the table is already sorted by the selected column, the sort function toggles between ascending and descending order.
Queries by User
This table provides a detailed breakdown of the queries that are made by each user in the selected time period.
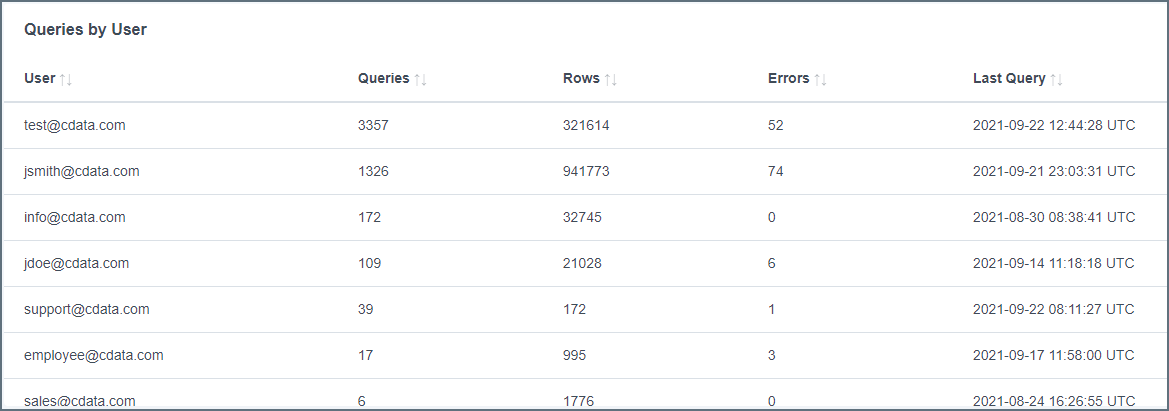
There are five columns in this table:
- User: The name of the user who performs the queries
- Queries: The number of queries that are performed by the user in the selected time period
- Rows: The number of rows that are processed by the user in the selected time period
- Errors: The number of failed queries for the user in the selected time period
- Last Query: The date and time of the user’s last query, formatted as YYYY-MM-DD HH:MM:SS UTC
Clicking the name of a column sorts the table by that column. If the table is already sorted by the selected column, the sort function toggles between ascending and descending order.